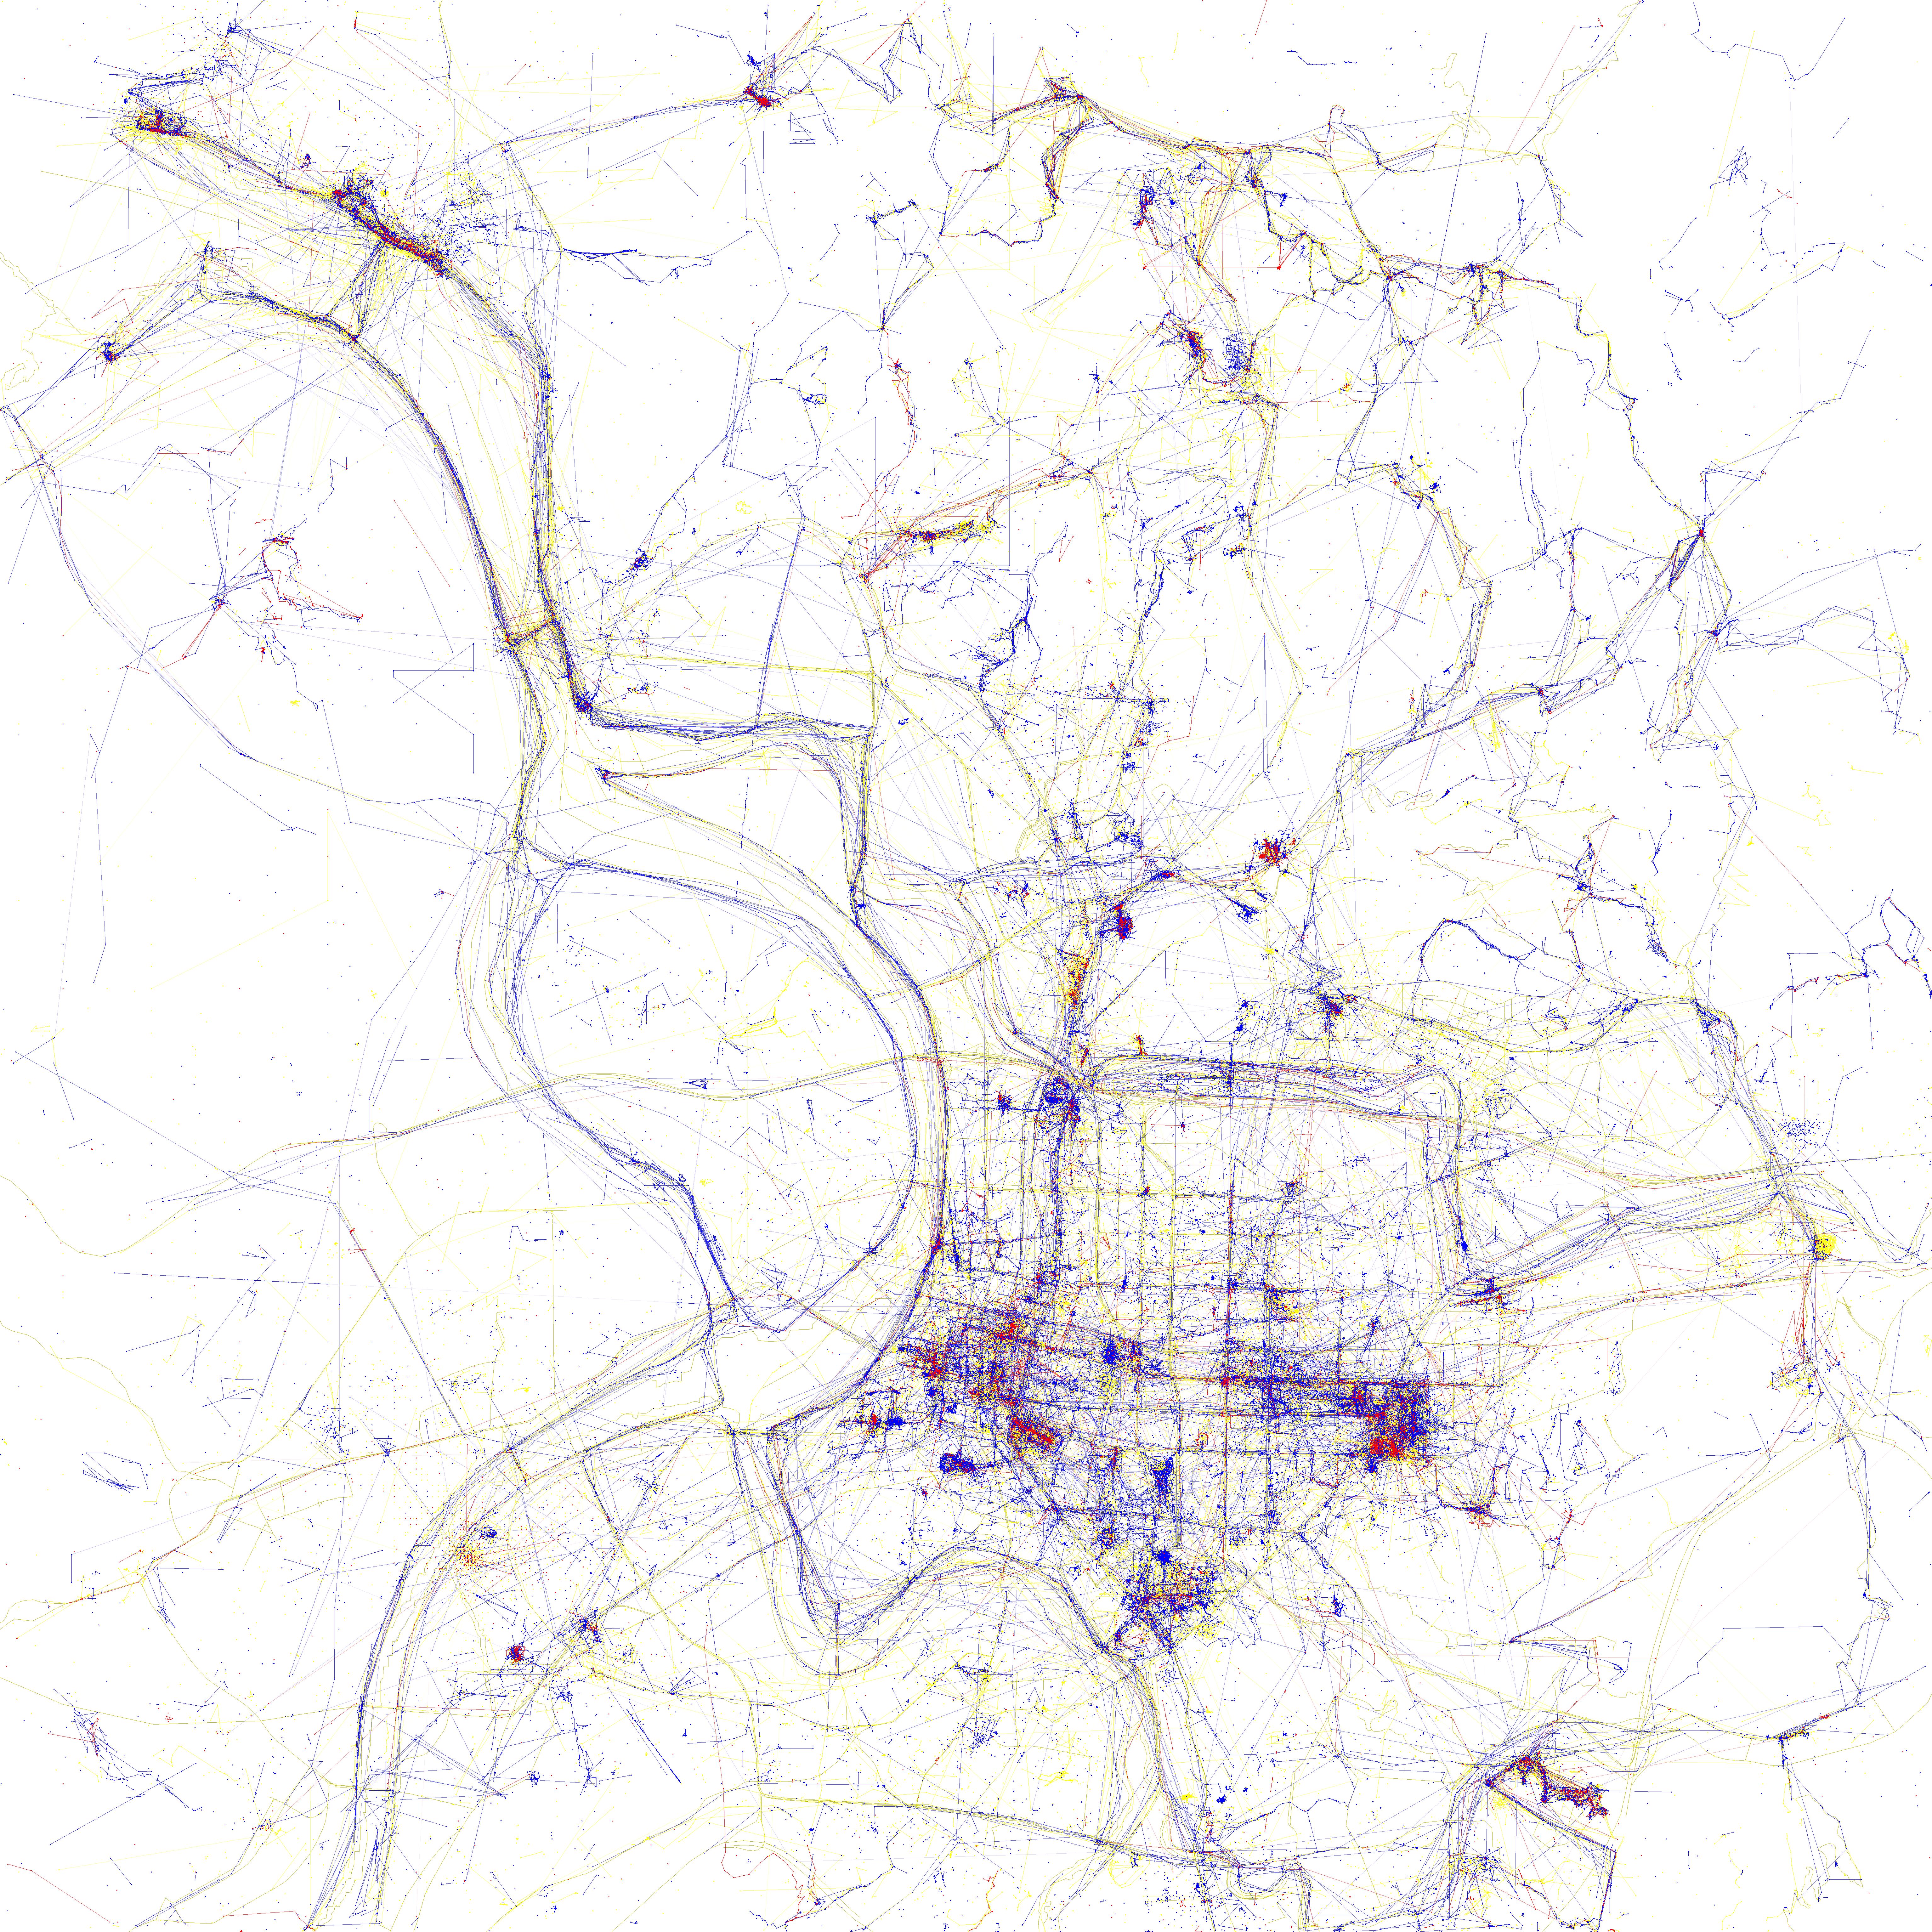
資料視覺師 Eric Fischer 與 MapBox 合作,透過 Twitter 的資料,創造出一系列旅人與居民的地圖 – 根據推特發文的資料在地圖上畫出居民及旅人活動範圍的差異。藍點代表當地居民 (在一個城市內發推超過一個月或更久)、紅點代表旅人 (在一個非居住城市內發推時間低於一個月)、黃點代表都有可能,可以從地圖上看出兩者的活動範圍有非常大的差距。
想要觀看所有資料,可以透過這兩個方式:
- MapBox 網頁互動式:MapBox: Locals & Tourists
- Eric Fischer Flicker 大圖:Locals and Tourists
台北市的旅人與居民地圖: Locals & Tourists, Taipei (2010)
與台北市地圖覆蓋觀看
有了這張圖,衍生出來的一個想法就是:把圖片疊在地圖上看!
這張圖的作法如下:
- 透過 Map Warper 將圖片與地圖透過點對點定位結合 (Rectify map) – 結果 (共31 個定位點)
- 將結果輸出為 GeoTIFF 格式的檔案
- 透過 gdal2tiles.py 自動產生地圖磚,並且自動產生 leaflet / googlemaps / KML 等檔案
gdal2tiles.py -z11-18 foobar.tif tiledir- 使用 foobar.tif 產生 zoom 11~18 的檔案到 tiledir
- 如果要改變或增加 zoom level, 可以透過
-e來產生圖磚
- 手動修正加入 opacity slider 等控制元件
Leave a Reply